|
| void | setSource (const QString &s) |
| |
| void | setSources (const QStringList &l) |
| |
| void | ctxSwap (CumbiaPool *cp, const CuControlsFactoryPool &fp) |
| |
| void | addSource (const QString &s) |
| |
| void | unsetSource (const QString &s) |
| |
| void | unsetSources () |
| |
| void | setOptions (const CuData &options) |
| |
| void | setPeriod (int p) |
| | Changes the refresh period on the plot, issuing a setData on every reader with a CuData containing the "period" property set to p.
|
| |
| void | requestLinkStats () |
| |
| virtual void | refresh () |
| | Calls updateMarkers, updateScales and replot, resetting the zoom base in the end.
|
| |
| void | setXAxisAutoscaleEnabled (bool en, QwtPlot::Axis axis) |
| |
| void | setYAxisAutoscaleEnabled (bool en, QwtPlot::Axis axis) |
| |
| void | setXTopAxisAutoscaleEnabled (bool autoscale) |
| |
| void | setYRightAxisAutoscaleEnabled (bool autoscale) |
| |
| void | setYLowerBound (double l) |
| |
| void | setYUpperBound (double u) |
| |
| void | setXLowerBound (double l) |
| |
| void | setXUpperBound (double u) |
| |
| void | setXAutoscaleMargin (double d) |
| |
| void | setUpperBoundExtra (int axisId, double e) |
| | add some extra upper bound to the specified axis to optimize replot operations when the refresh rate is fast.
|
| |
| double | upperBoundExtra (int axisId) const |
| |
| double | xAutoscaleMargin () |
| |
| void | setYAutoscaleAdjustment (double d) |
| |
| double | yAutoscaleAdjustment () |
| |
| void | setTitleOnCanvasEnabled (bool en) |
| |
| void | setCurveStyle (const QString &curveName, QwtPlotCurve::CurveStyle) |
| |
| void | setDataBufferSize (int b) |
| |
| void | setZoomDisabled (bool) |
| |
| void | clearPlot () |
| |
| virtual void | setData (const QString &curveName, const QVector< double > &xData, const QVector< double > &yData) |
| |
| virtual void | setData (const QString &curveName, double *xData, double *yData, int size) |
| |
| virtual void | appendData (const QString &curveName, double x, double y) |
| |
| virtual void | insertData (const QString &curveName, double *xData, double *yData, int size, double default_y=0.0) |
| | insert data into the plot ordered by x values
|
| |
| void | setRefreshTimeout (int millis) |
| |
| void | setDefaultBounds (double lb, double ub, Axis axisId=QwtPlot::yLeft) |
| |
| void | restoreDefaultBounds (Axis axisId=QwtPlot::yLeft) |
| | restores the bounds set with setDefaultBounds
|
| |
| void | setAxisScaleDefaultEnabled (bool en, Axis axisId=QwtPlot::yLeft) |
| | Restores the bounds of axisId to their default values if en is true, does nothing if en is false.
|
| |
| void | setXAxisAutoscaleEnabled (bool autoscale) |
| |
| void | setYAxisAutoscaleEnabled (bool autoscale) |
| |
|
| | QuSpectrumPlot (QWidget *w, Cumbia *cumbia, const CuControlsReaderFactoryI &r_fac) |
| | Constructor with the parent widget, an engine specific Cumbia implementation and a CuControlsReaderFactoryI interface.
|
| |
| | QuSpectrumPlot (QWidget *w, CumbiaPool *cumbia_pool, const CuControlsFactoryPool &fpool) |
| | Constructor with the parent widget, CumbiaPool and CuControlsFactoryPool
|
| |
| | QuSpectrumPlot (QWidget *parent) |
| | single parent-widget constructor. QuApplication properly initialized with cumbia engine objects is compulsory.
|
| |
| virtual | ~QuSpectrumPlot () |
| |
| QString | source () const |
| |
| QStringList | sources () const |
| |
| int | period () const |
| | Get the refresh period of the sources issuing a getData on the first reader in the list.
|
| |
| CuContext * | getContext () const |
| | Return a reference to the CuContext in use.
|
| |
| void | onUpdate (const CuData &d) |
| |
| void | update (const CuData &d) |
| |
| | QuPlotBase (QWidget *parent) |
| | The constructor of a simple plot with zooming and scrolling capabilities.
|
| |
| | QuPlotBase (const QwtText &title, QWidget *parent) |
| | The constructor of a simple plot with zooming and scrolling capabilities.
|
| |
| virtual | ~QuPlotBase () |
| |
| CurveStyle | curvesStyle () |
| |
| bool | titleOnCanvasEnabled () |
| |
| bool | xAxisAutoscaleEnabled (QwtPlot::Axis axis=QwtPlot::xBottom) |
| |
| bool | yAxisAutoscaleEnabled (QwtPlot::Axis axis=QwtPlot::yLeft) |
| |
| double | yUpperBound (QwtPlot::Axis axis=QwtPlot::yLeft) |
| |
| double | yLowerBound (QwtPlot::Axis axis=QwtPlot::yLeft) |
| |
| double | xUpperBound (QwtPlot::Axis axis=QwtPlot::xBottom) |
| |
| double | xLowerBound (QwtPlot::Axis axis=QwtPlot::xBottom) |
| |
| double | defaultLowerBound (QwtPlot::Axis axisId=QwtPlot::yLeft) const |
| |
| double | defaultUpperBound (QwtPlot::Axis axisId=QwtPlot::yLeft) const |
| |
| bool | xAxisLogScale (QwtPlot::Axis axis=QwtPlot::xBottom) |
| |
| bool | yAxisLogScale (QwtPlot::Axis axis=QwtPlot::yLeft) |
| |
| void | setXAxisLogScale (bool l, QwtPlot::Axis axis=QwtPlot::xBottom) |
| |
| void | setYAxisLogScale (bool l, QwtPlot::Axis axis=QwtPlot::yLeft) |
| |
| bool | zoomDisabled () const |
| | returns false if the zoom is enabled (the default), true otherwise.
|
| |
| QList< QwtPlotCurve * > | curves () const |
| |
| void | addCurve (const QString &curveName, QuPlotCurve *curve) |
| |
| void | removeCurve (const QString &curveName) |
| | Removes the specified curve from the plot, deleting it.
|
| |
| void | addCurve (const QString &curveName) |
| |
| QuPlotCurve * | curve (const QString &name) |
| |
| int | dataBufferSize () |
| | returns the data buffer size.
|
| |
| void | hideMarker () |
| |
| void | appendData (const QString &curveName, double *x, double *y, int size) |
| |
| int | refreshTimeout () const |
| |
| void | configure (const CuData &da) |
| |
| void | setUpdateStrategy (QuWidgetUpdateStrategyI *updateStrategy) |
| | sets or replaces the update strategy (see the strategy design pattern)
|
| |
| void | setContextMenuStrategy (QuWidgetContextMenuStrategyI *ctx_menu_strategy) |
| | sets or replaces the context menu strategy (see the strategy design pattern)
|
| |
| QuWidgetUpdateStrategyI * | updateStrategy () const |
| | return the QuWidgetUpdateStrategyI implementation in use.
|
| |
| QuWidgetContextMenuStrategyI * | contextMenuStrategy () const |
| | return the QuWidgetContextMenuStrategyI implementation in use.
|
| |
| virtual QDialog * | createConfigureDialog () |
| |
| virtual bool | updateMarker () |
| | updates the marker, if visible, and returns true if it's visible, false otherwise
|
| |
| virtual bool | updateScales () |
| | Updates the axes bounds for which autoscale is enabled.
|
| |
| void | resetZoom () |
| |
| bool | inZoom () const |
| |
| QuPlotComponent * | getComponent (const QString &name) const |
| | returns the QuPlotComponent corresponding to the given name, nullptr if name is not valid
|
| |
| void | registerComponent (QuPlotComponent *, const QString &name) |
| |
| QuPlotComponent * | unregisterComponent (const QString &name) |
| | QuPlotBase::unregisterComponent unregister the component with the given name.
|
| |
| virtual | ~QuWidgetInterface () |
| |
| virtual | ~CuContextI () |
| |
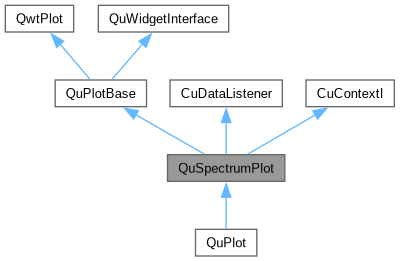
Draw a line for each data source over time.
QuSpectrumPlot is designed to accept a list of data sources. Each data source is represented by a curve in the plot, which is updated according to the CuData "value" and "timestamp_ms" properties. If CuData "err" boolean is true or the "value" data format is not a scalar, the plot is disabled.
- Plot update strategies.
- Any implementation-specific data update is delegated to an update strategy through setUpdateStrategy. If no update strategy is set, then the update method is called from within onUpdate and the base operations aforementioned are performed. Strategies must implement QuWidgetUpdateStrategyI interface.
 Public Slots inherited from QuPlotBase